
Nowadays, digital technology influences even the most minor details of our lives and has become a part of our day-to-day activities. Devices like laptops, phones, smart devices (like fridges, TVs, lightbulbs, coffee makers, security gadgets), and much more now have access to our networks (wired or wireless). However, that also raises another issue – Network Security and Reliability of these devices. You need to ensure the network is performing at the speed and efficiency required and that the devices are available (online) at all times as required.
An essential tool to keep track of what is happening on your network is a Network Monitor. That is a hardware component or software that monitors a computer network for slow or failing parts. Some even send alerts to the administrator in case of outages or malicious activities. This post will give you a detailed guide on setting up your Raspberry Pi into a network monitoring tool.
Why use a Raspberry Pi instead of a PC?
If you want to manage your home network, which comprises a couple of devices, then dedicating a single PC to monitor the network would be a waste. The PC will consume too much power, occupy a lot of space, and resources like RAM and CPU would have been used to perform other activities. On the other hand, the Raspberry Pi is a single piece of hardware that consumes much less power, occupies a tiny space, and is far cheaper. That makes it the best option to set up a Network Monitor for your home network.
NEMS (Nagios Enterprise Monitoring Server)
There are different tools you can use to set up a network monitor. However, in this post, we will install the Nagios Network monitoring tool. It’s a popular open-source network monitoring tool available for Windows and Linux systems. Luckily, it also provides users with the ARM version to run on small board computers like the Raspberry Pi.
There are two main ways you can install and run Nagios on your computer:
- Install the full-featured Nagios Linux image
- Install Nagios on your existing Raspberry Pi OS
We will look at installing the full-featured Nagios Linux image, which is much easier and comes with several utilities installed to monitor your network.
Requirements
- Raspberry Pi 3 or later – For better performance, it’s highly recommended you run NEMS on Raspberry Pi 3 or later.
- At least 8 GB microSD card
- The Balena Etcher utility.
Installing the full-featured NEMS Linux image
To get started, download the NEMS Linux image for Raspberry Pi. It’s a pretty big file (around 2 GB). Therefore, it might take some time to download, depending on your internet speed. When done, download the Balena Echer utility for flashing the image on our SD card. Once you have the two files downloaded, follow the steps below to install NEMS on your Raspberry Pi.
Step 1: Flash the NEMS Linux image on the SD Card
The NEMS image comes in a zipped format. Therefore, you will need to extract to retrieve the .img file. Once done, launch Balena Etcher from the applications menu or run the Balena AppImage file if you are on a Linux system. You will see a window similar to the image below.
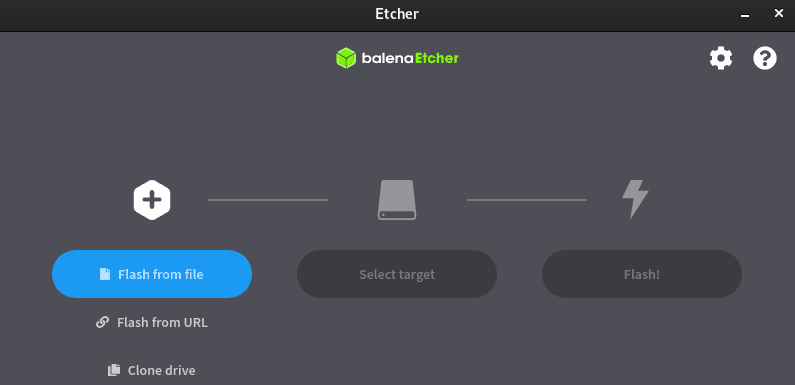
Balena Etcher
Click on the Flash from file button and select the NEMS image file. Next, click Select Target and choose your SD card. Finally, click Flash to start writing the image to the SD card.
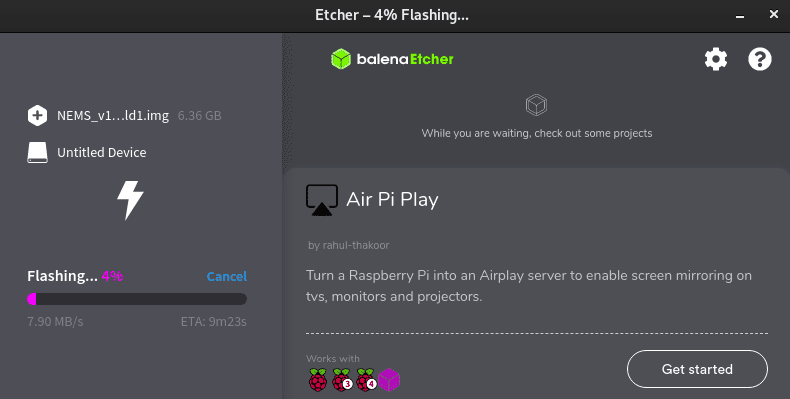
flash nems
When the flashing process completes successfully without errors, remove the SD card from your PC and insert it in your Raspberry Pi.
Step 2: Boot the Raspberry Pi
Before starting your Pi, ensure you have connected all the required peripherals. That includes an ethernet connection. When done, plug the power cable to start the Raspberry Pi. If you wish to use a wireless connection (WIFI), please read our post Connecting to Wi-Fi & Enabling SSH Without Monitor on Raspberry Pi.
NEMS will boot, and you will see lines of system output running down your screen. After some time, you will see the NEMS Server Overview screen, which displays information like NEMS version, Platform, Hostname, Ip address, CPU usage, CPU temperature, Disk Usage, and much more.
Step 3: Manage NEMS From the Browser
NEMS comes with a browser interface to access and manage your Network Monitor. Launch the browser on any PC connected to the same network as the Raspberry Pi and enter the Pi’s IP address as the URL. You will see a window similar to the image below.
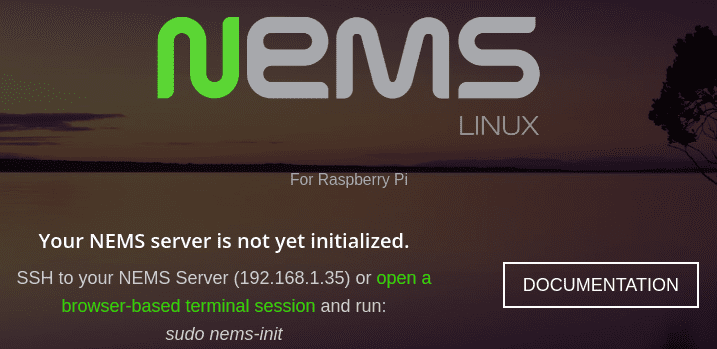
NEMS browser window
On the image, you can see the message “Your NEMS server is not yet initialized.” To initialize the server, you can create an SSH connection or open the browser-based terminal by clicking the link on the NEWS browser window. In our case, we will connect to NEMS via SSH. First, however, we will still discuss the other method (browser-based terminal).
Connect to NEMS via SSH
Launch the terminal and run the command below:
ssh nemsadmin@[Raspberry IP Address]
e.g
ssh nemsadmin@192.168.1.35
Note: The default login credentials for NEMS are:
- Username: nemsadmin
- Password: nemsadmin
After a successful login, you will see a screen similar to the image below:
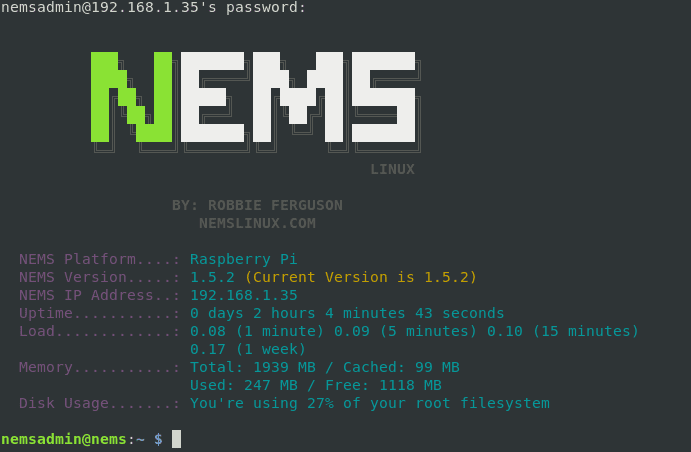
NEMS
Connect to NEMS via the browser-based terminal
Alternatively, if you wish to the browser terminal, click on the link on your NEMS browser window. That will open the NEMS login screen. Enter the user name as nemsadmin and password as nemsadmin.
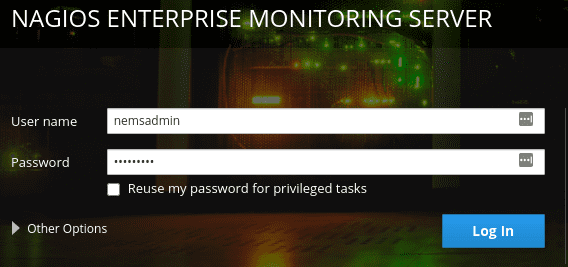
NEMS browser login
After a successful login, you will see the NEMS browser-based Terminal, as shown in the image below. It looks a little more intuitive compared to the primary terminal. You can easily navigate to the sections like Logs, Storage, Networking, etc.
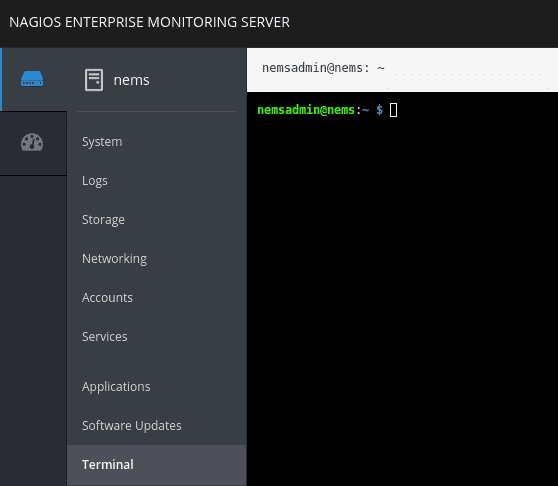
NEMS browser
Step 4: Configure NEMS installation
If running a NEMS ssh session or using the browser-based terminal, run the command below to configure NEMS for first-time installation.
sudo nems-init
In the first screen, you will need to select the geographic area in which you live. Select OK when done.
Tip: Use Arrow and Tab keys to scroll through the different options.
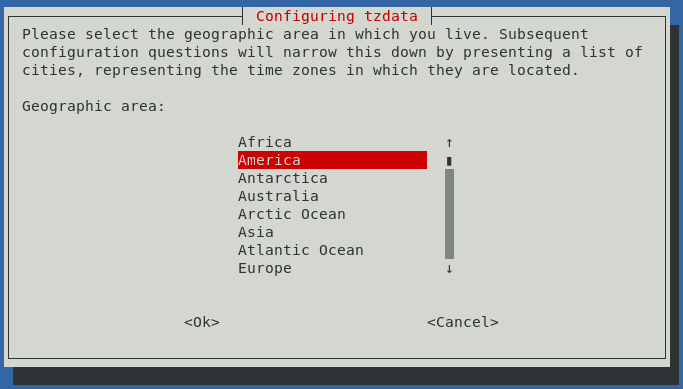
Configure tzdata
On the next screen, please select the city or region corresponding to your time zone. Select OK when done.
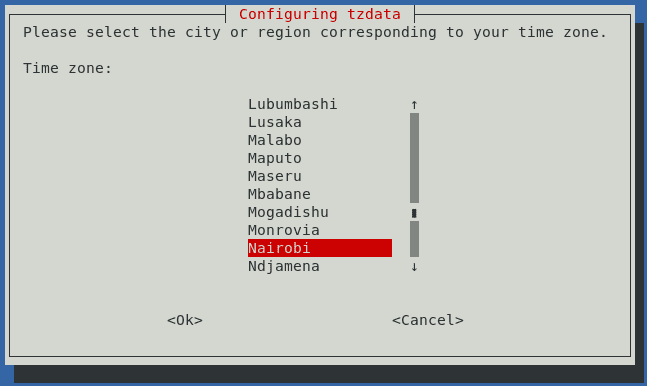
Select City
On the next screen, configure your locales.
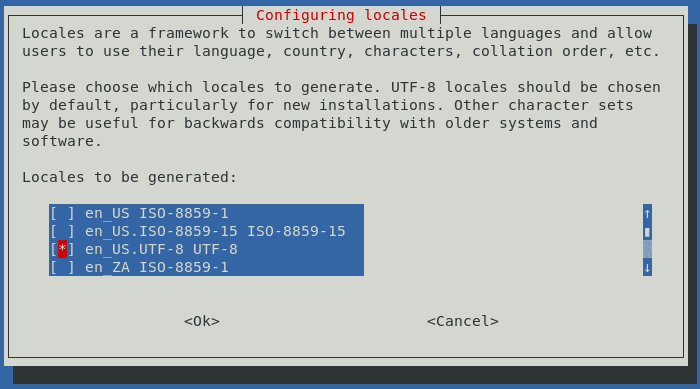
Configuring locales
When done, you will be prompted to set up a new username, password, and an email where you will receive notifications and updates, as shown in the image below.
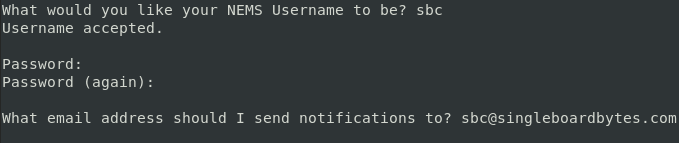
New user details
The system will proceed to create an account for the new user and generate new SSL certificates. When done, navigate to your browser and enter the URL below:
https://[Raspberry IP Address]
e.g
https://192.168.1.35
Unlike before, you will now see a completely different screen and NOT the message “Your NEMS server is not yet initialized.”
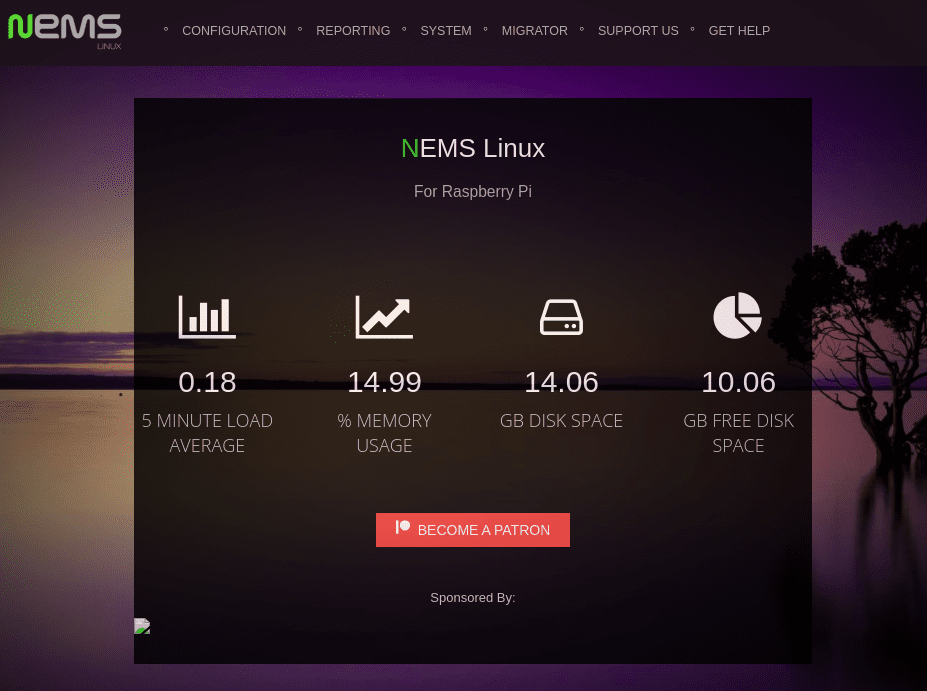
NEMS Linux
NEMS Dashboards for network monitoring
NEMS comes with various dashboards for network and system monitoring. They include;
- Adagios
- NEMS Mobile UI
- NEMS TV Dashboard
- NEMS Tactical Overview
- Nagios Core
- NagVis
- Nagios Graphs
You can access these dashboards by hovering the mouse on the Reporting menu at the top of the window.
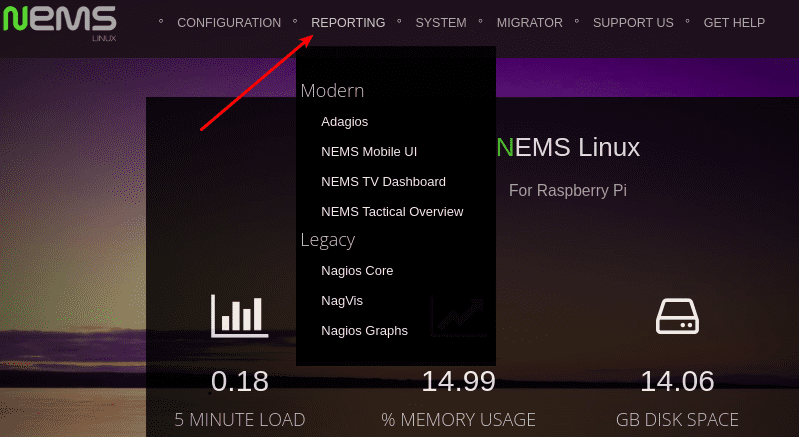
Dashboards
Conclusion
That’s it! You now have NEMS running on your Raspberry Pi. When you start navigating through the various options on the NEMS window, you will realize that you can utilize many options and configurations. It can also be configured to send any alerts from your network. However, there is no need to do anything in a rush; go over every option and dashboard, understanding what it does before proceeding to the next. If you come across any issues, feel free to leave a comment, and we will help where we can.